Analytics
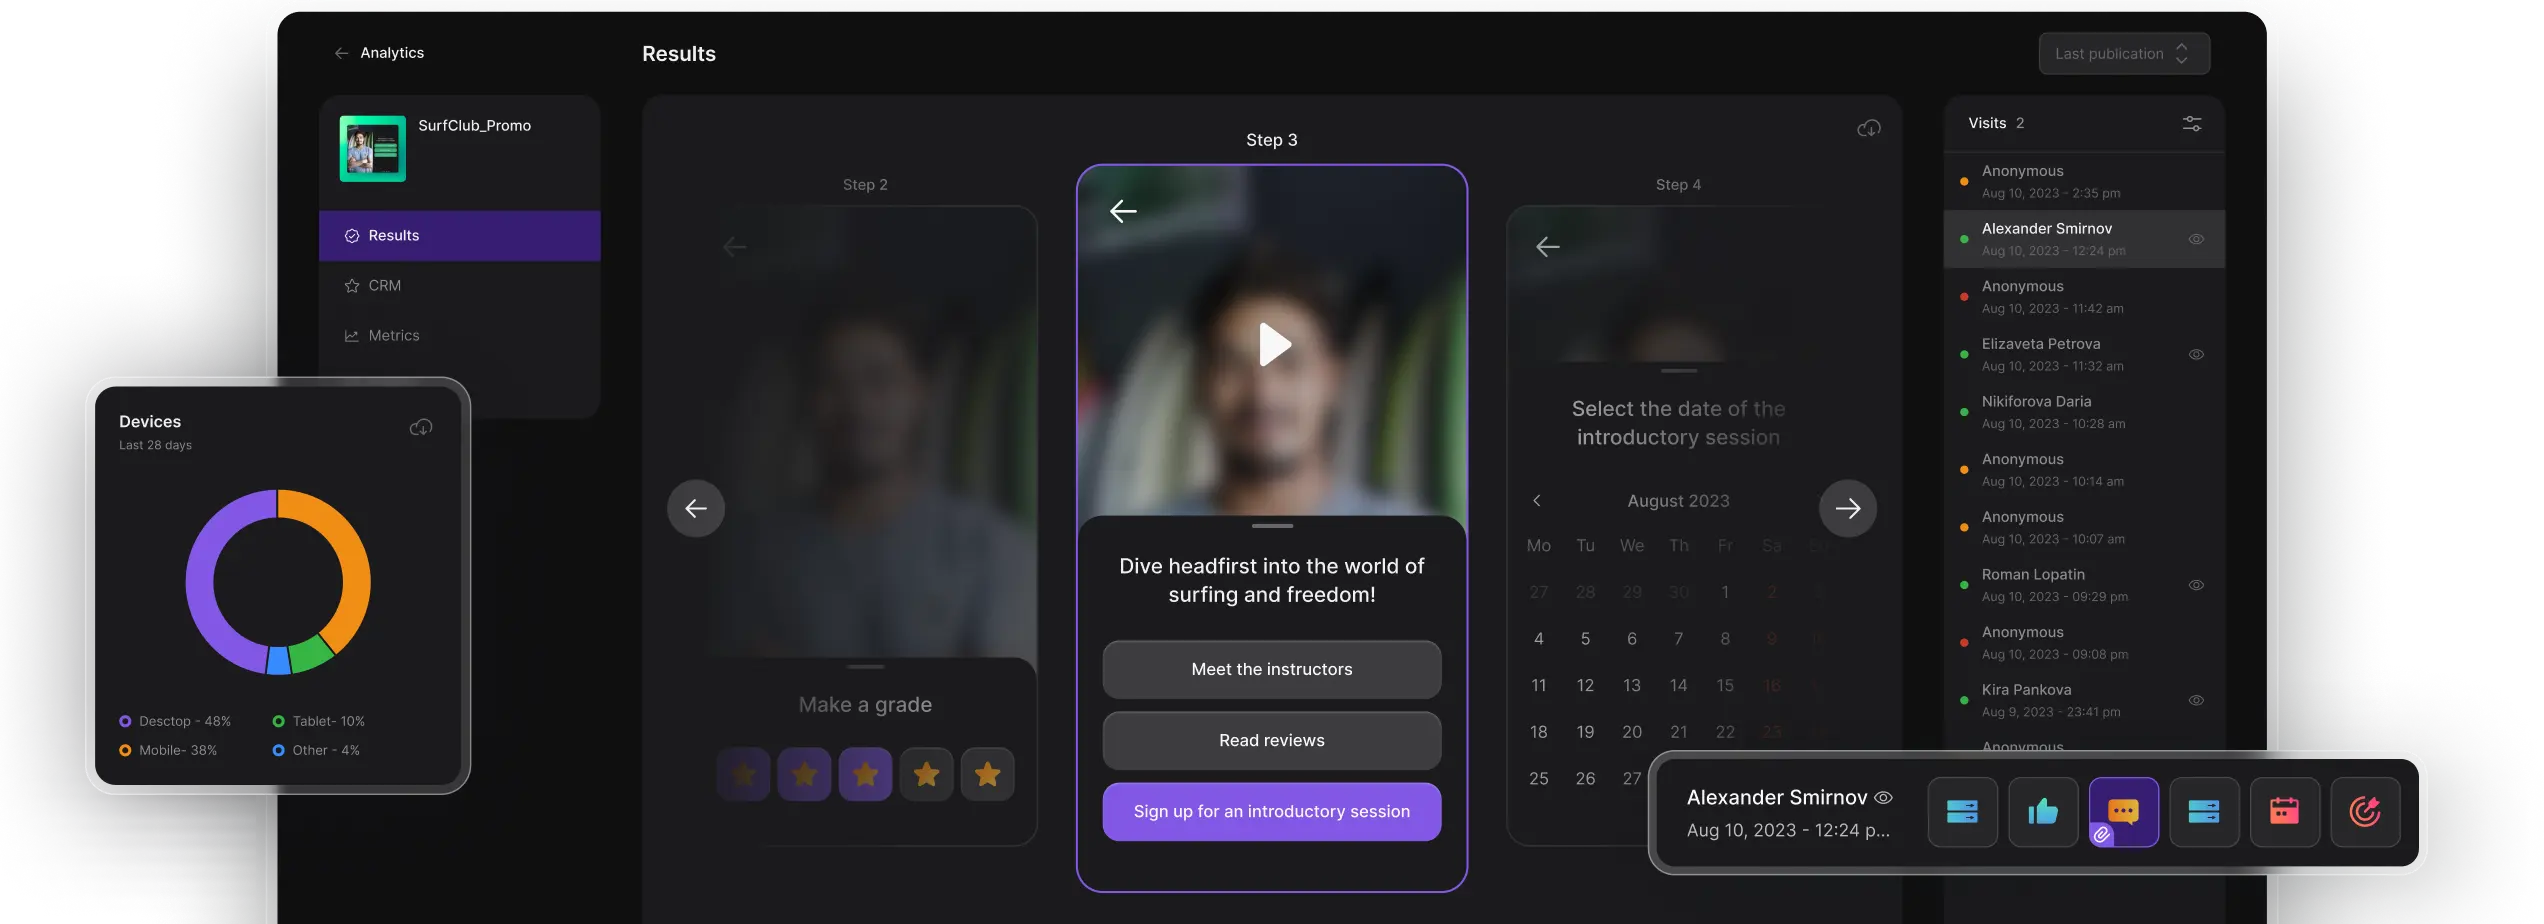
Results
Evaluate the effectiveness of each funnel step with user journey visualization—an intuitive display of all the steps a user has taken within the funnel. Identify which elements need improvement to boost conversion rates.

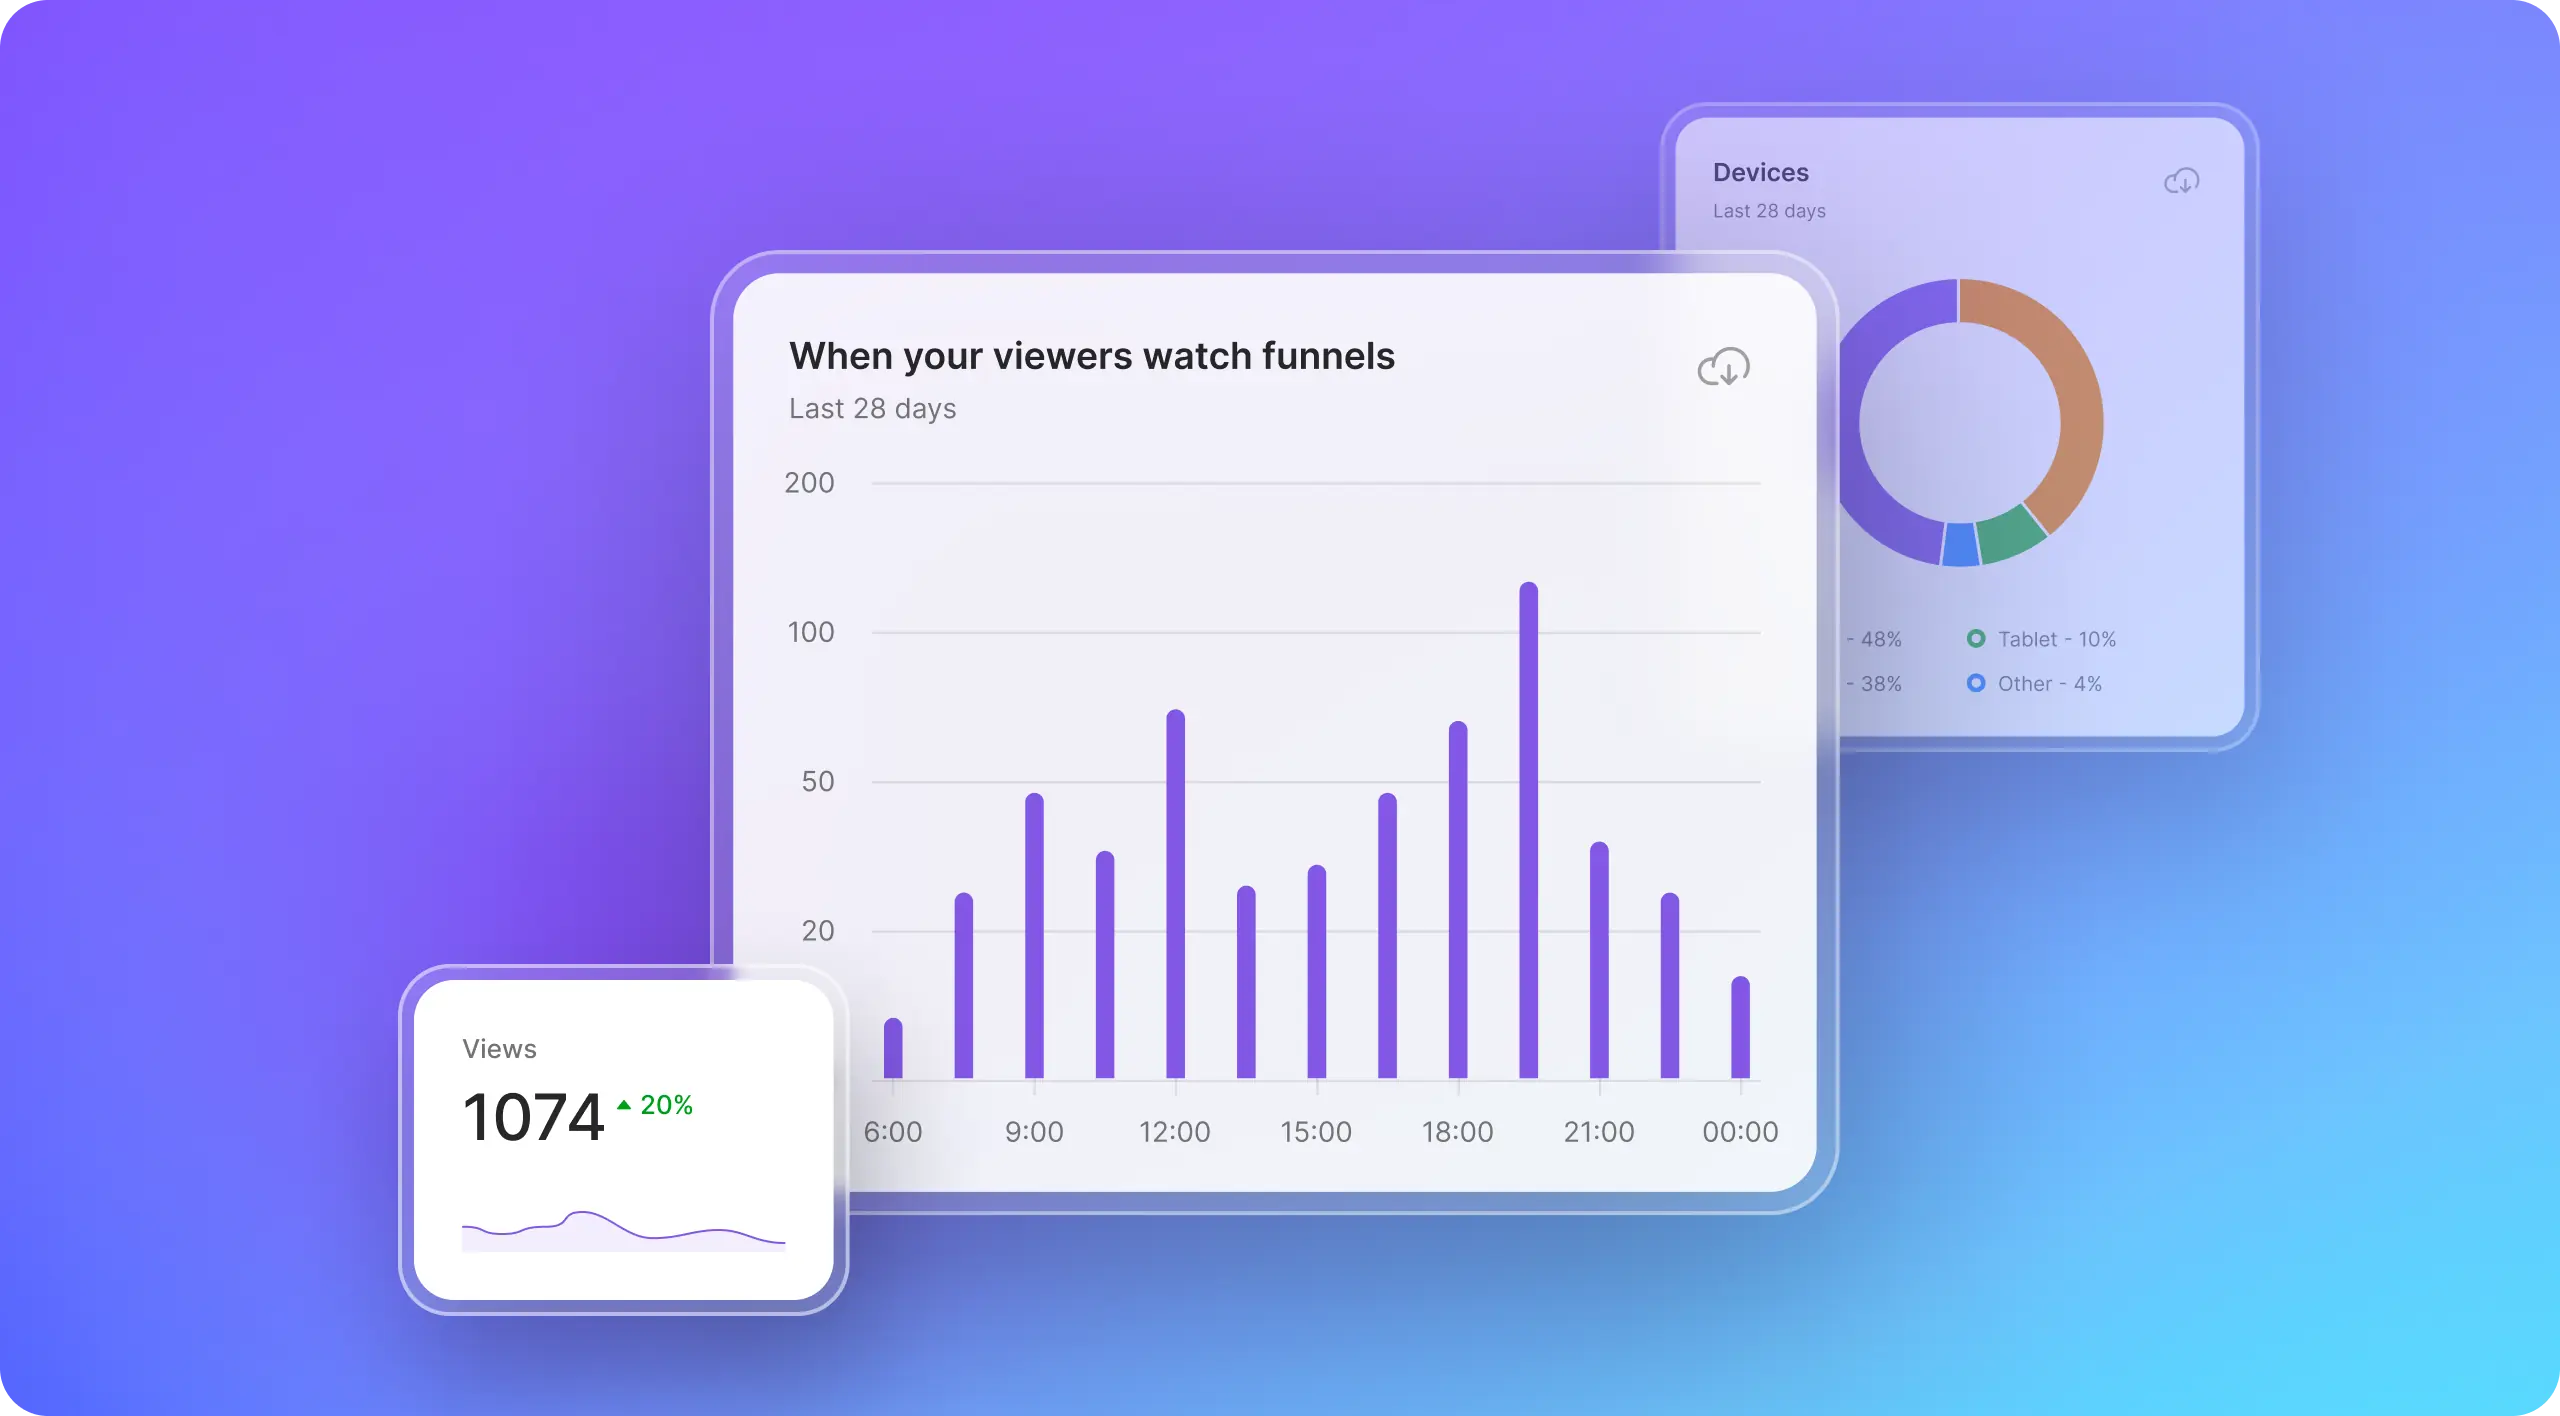
Metrics
Track the performance of each funnel with metrics such as visits, leads, conversions, and viewing time. Analyze trends to optimize your sales funnels.
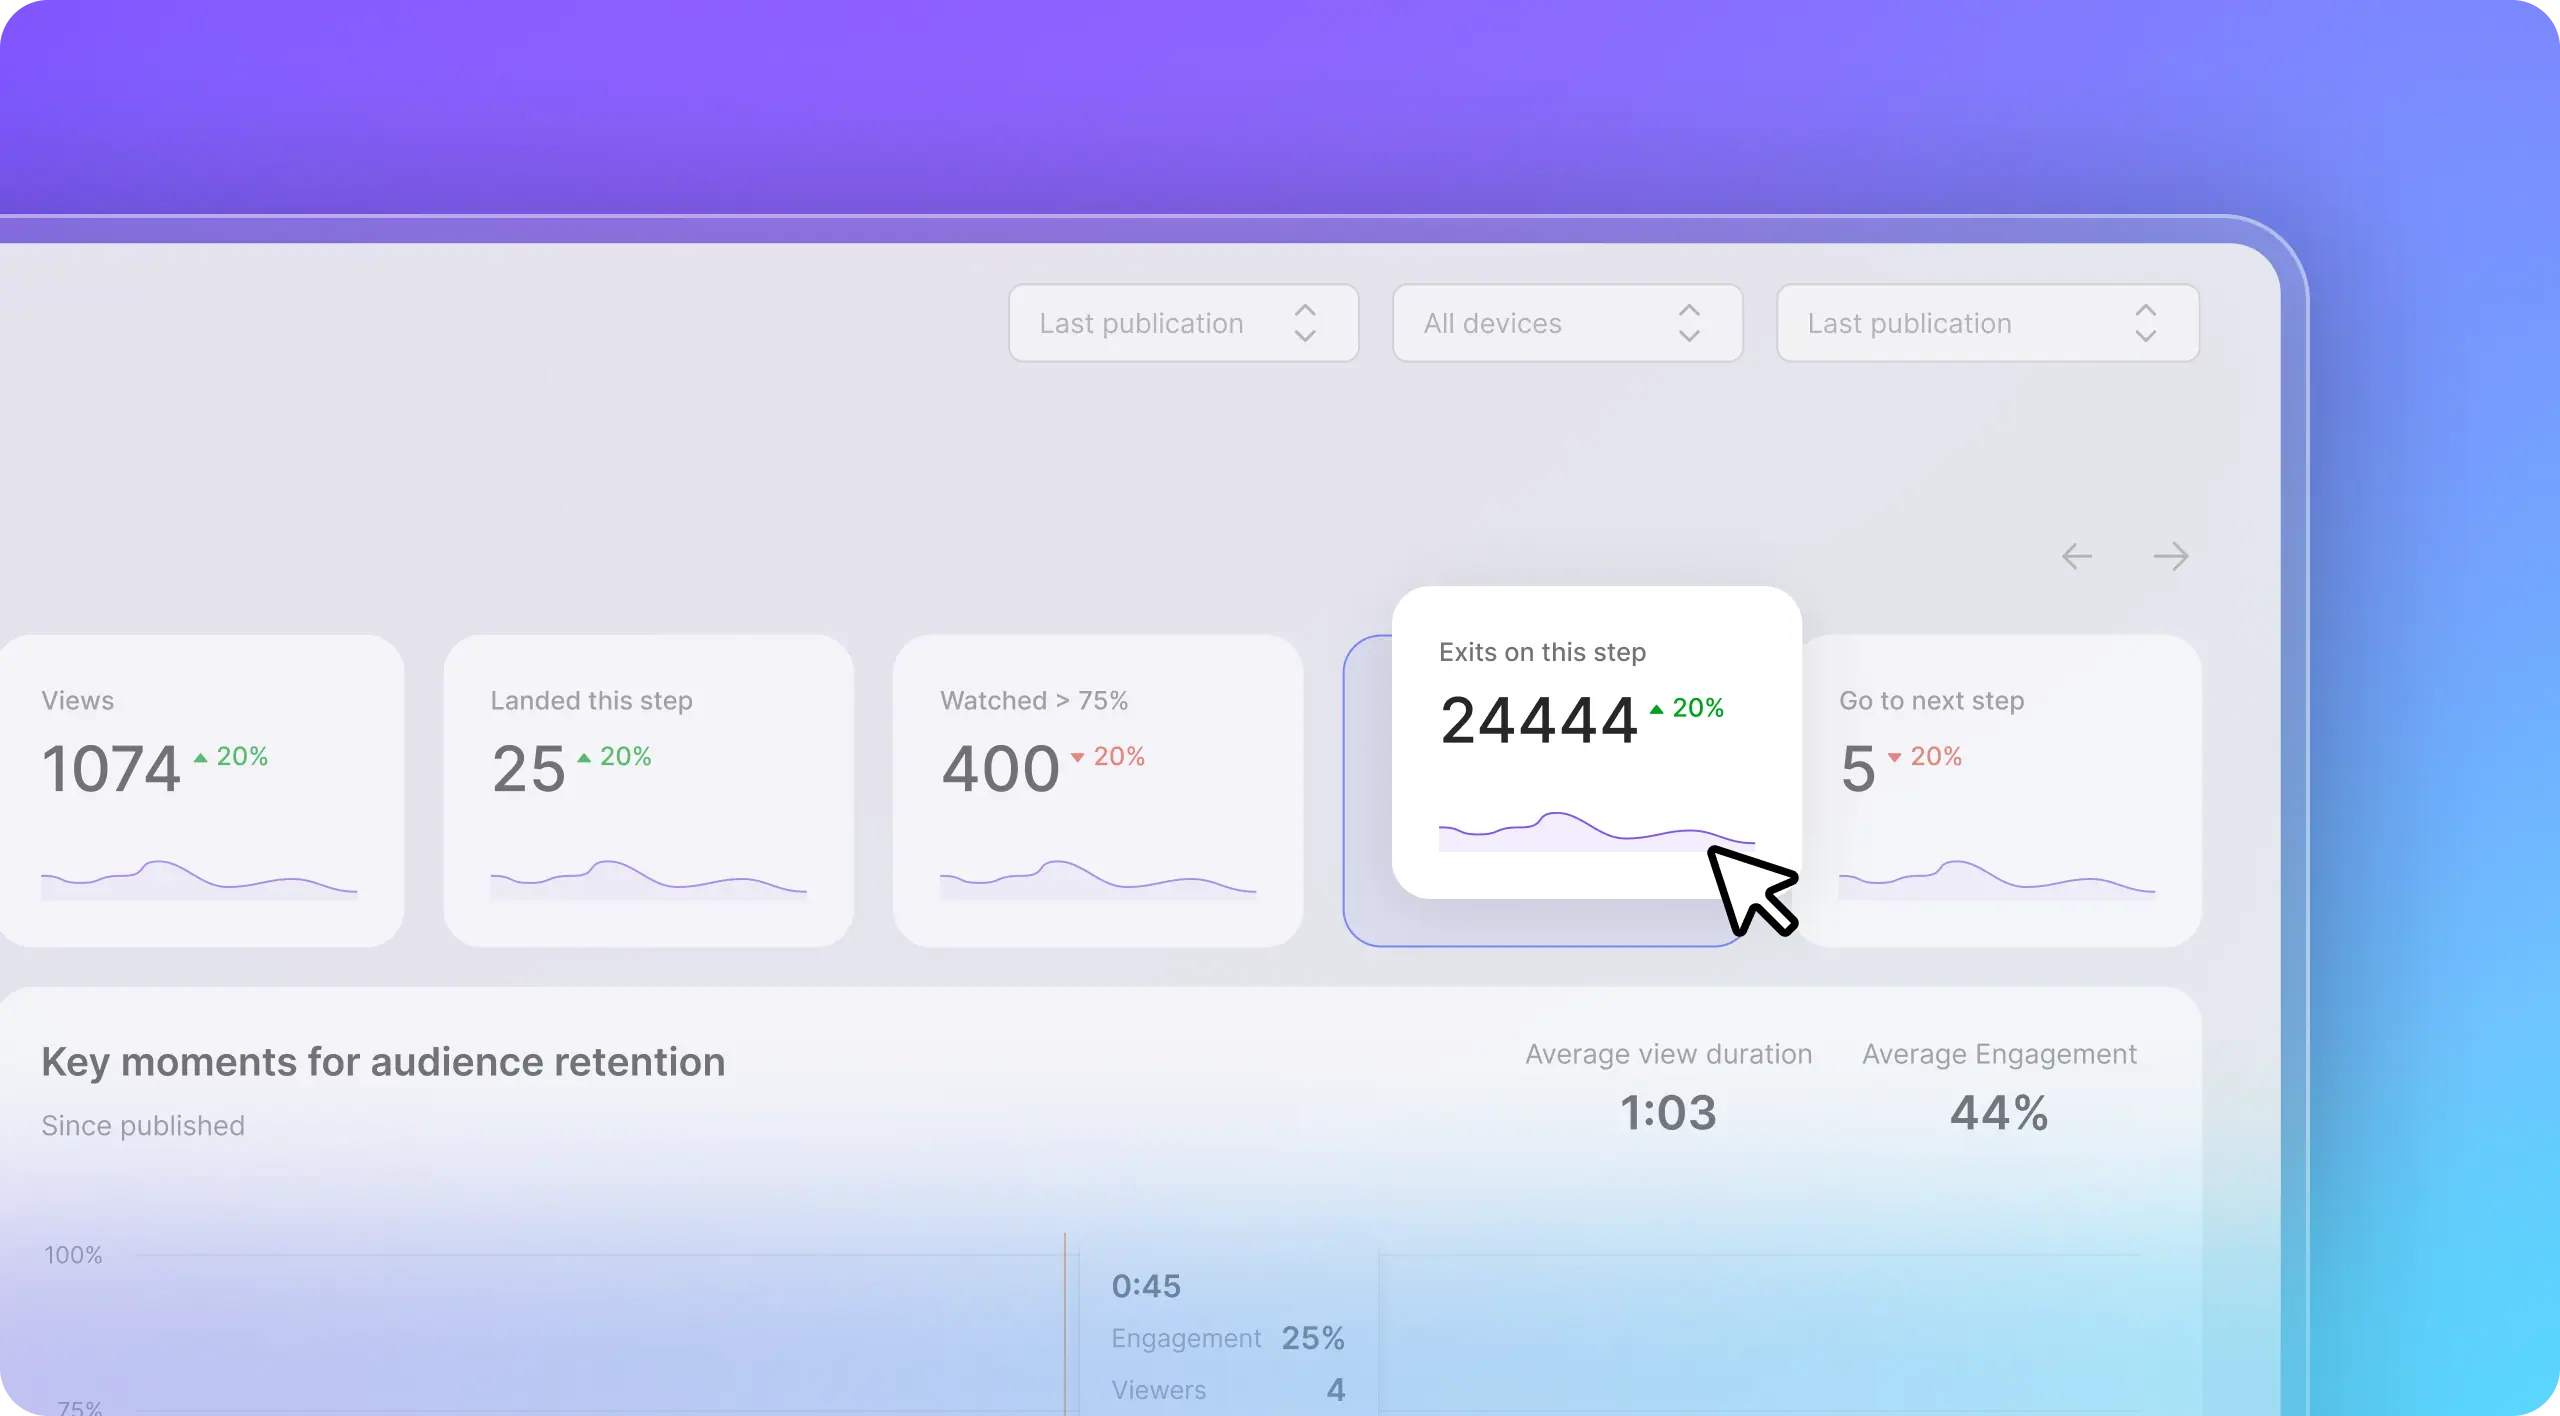
Drop-off analysis
Drop-off analytics identify issues in the script and improve the funnel by showing the drop-off rate for each step. By pinpointing critical user drop-off points, you can target and optimize the sales process.
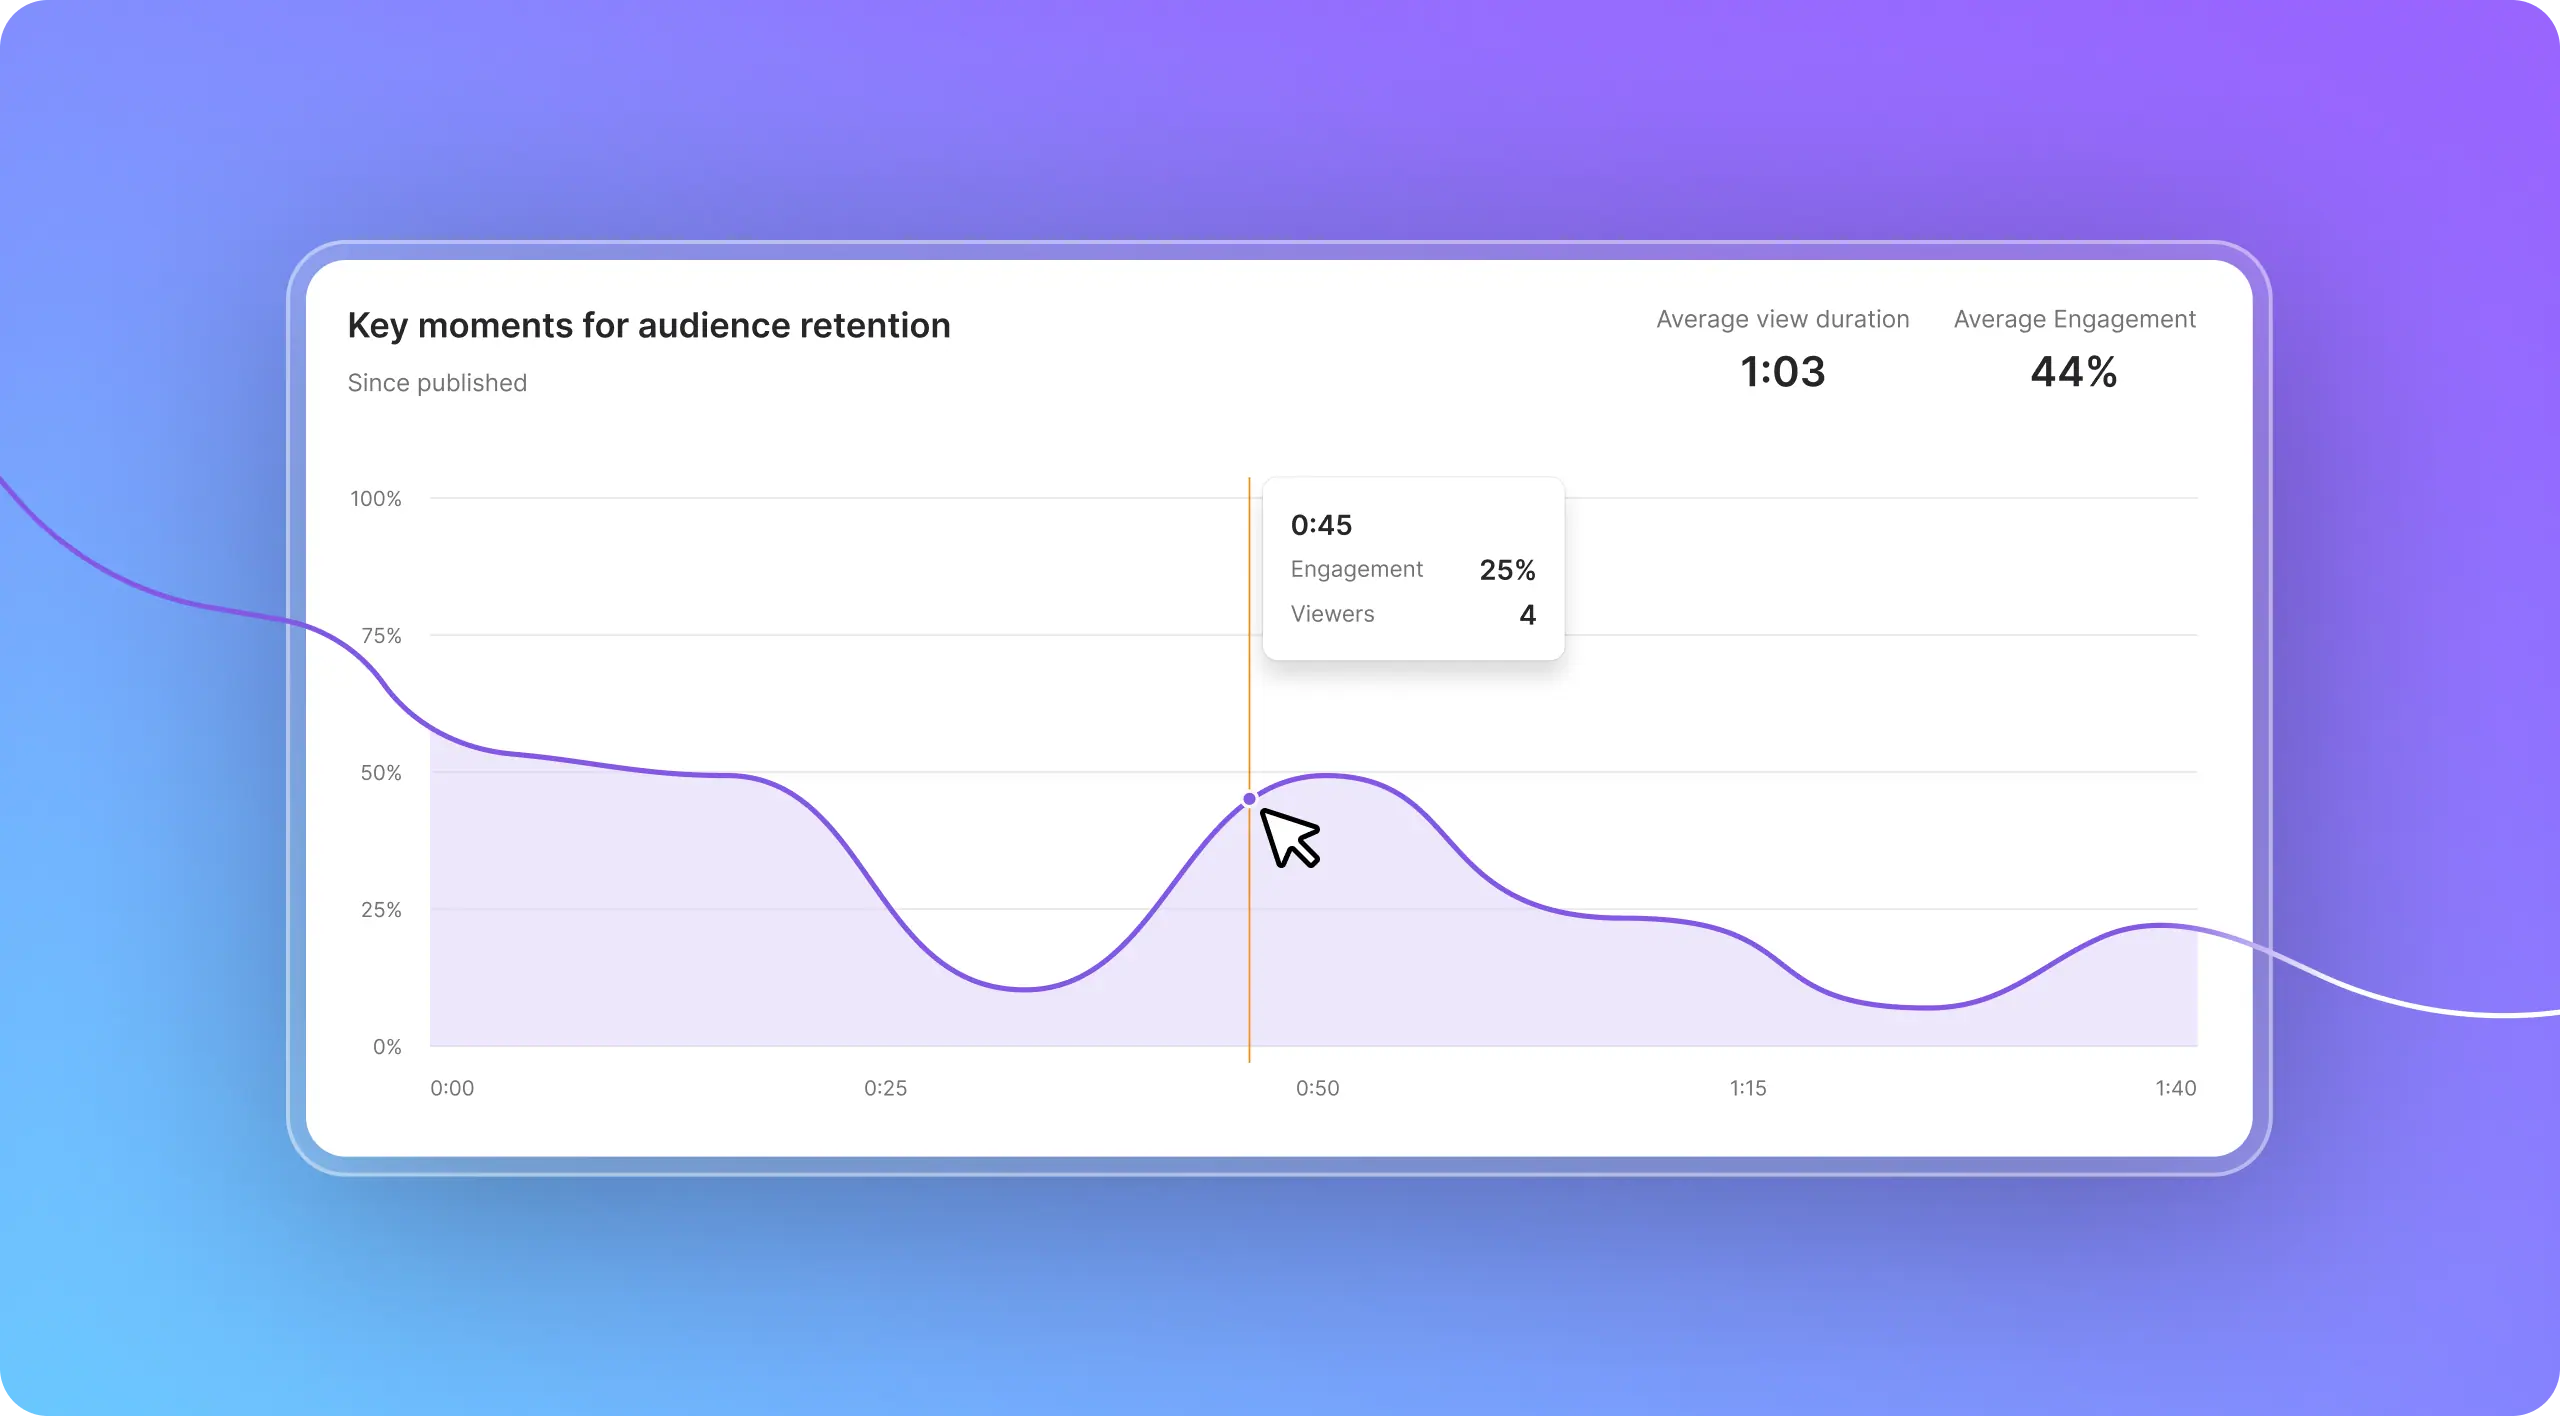
Interactive сharts
Use interactive charts for detailed dynamic metric analysis. Identify trends and anomalies to make informed decisions.
